A well optimized email marketing campaign is a great way to boost brand recognition, audience engagement and lifetime customer value. MailChimp, our favorite free email platform, includes a suite of powerful reporting tools for analysis of everything from which users are opening your messages to how many on-site conversions your email marketing is generating.
If you’re not taking advantage of the reporting metrics offered by MailChimp, you’re missing out on valuable data that can save you marketing dollars and increase your ability to effectively engage your existing and potential customers.
Here are 5 ways to improve your email campaigns using MailChimp’s reporting tools:
1. Activity
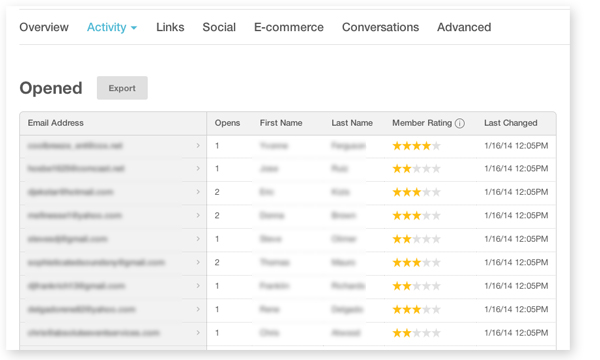
The Activity tab includes a handy dropdown menu that allows you to view which recipients opened, clicked, didn’t open, bounced, unsubscribed and complained. There is also a Member Rating column with a 1-5 star review for each recipient. The reviews are an average based on all emails sent to a given user. 1 or 2 stars is for members who either unsubscribed or bounced, while 3-5 stars is given to those who have opened or frequently open your messages.

2. Links
The Links section includes two extremely useful tabs for Click Performance and Click Map. This data breaks down which links in your email template are getting the most clicks, and where those clicks are going. The Performance tab reveals destination URLs, total clicks and unique clicks, while the Map shows a visual view of your email template with indicators next to each link showing the percentage of total clicks associated with each.
The links section is useful for several reasons. Most importantly, it allows you to test text, button and image links, to determine which attract the most clicks. Let’s say you embedded a button link that directs users to an ecommerce product page, but it did not get a lot of clicks. In the next email you send out, try positioning the button in a more visible location and consider switching up the visual style (color, text, etc.).
It is also useful to check Click Performance to make sure your URLs are all accurate and link to the correct pages. Sending people to a 404 page or the wrong page is a sure way to lose consumer confidence.
3. Email Domain Performance
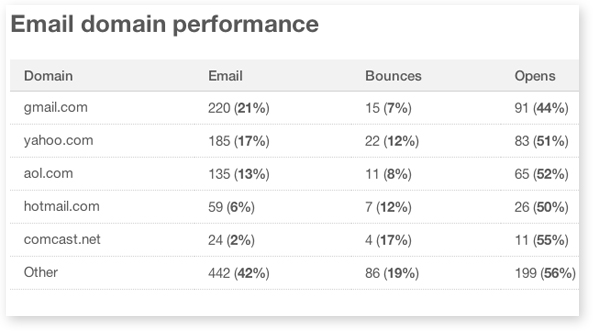
At the very bottom of the Advanced section you’ll find a chart displaying how your email performed on various email domains, such as gmail.com, yahoo.com, aol.com and hotmail.com. This tells you which email platforms your customers are using and how your campaign performed for each.
If you see any domains with high bounce rates and low open / click rates you’ll want to perform some cross-domain compatibility testing to find out what’s wrong. Not every email browser renders HTML/CSS the same way, so there’s a chance you may need to adjust your template design and/or coding.

4. 24-Hour Performance
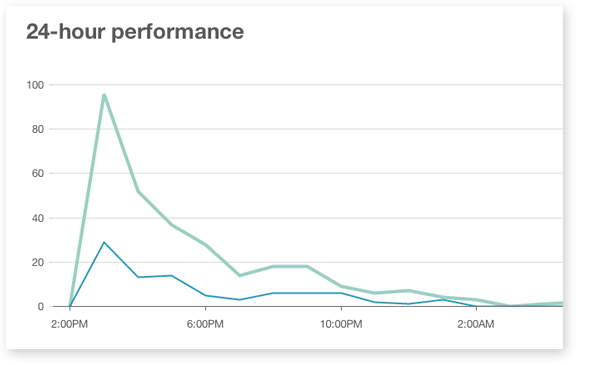
The Overview tab includes a chart showing when recipients opened your email. In some industries, customers are known to respond better to emails at given times throughout the day. By monitoring this graph over the course of multiple campaigns, you’ll be able to determine when your customers are more prone to interact with your emails. This tactic is known as dayparting and requires some in-depth analysis and testing before you find a formula that works.

5. Ecommerce Tracking
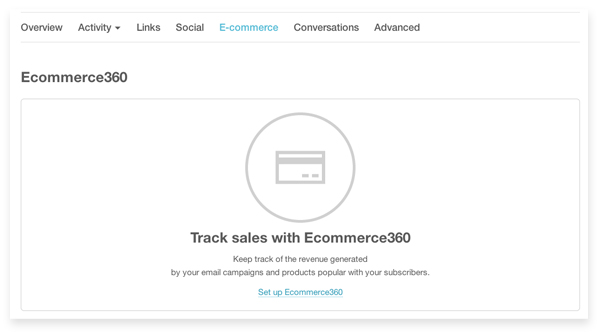
Perhaps the most powerful free tool offered by MailChimp is its Ecommerce360 system, which allows you to place a tracking script on your website that sends conversion data to MailChimp. This means every dollar your email marketing generates can be accurately tracked, giving you a firm handle on ROI projections.
The Ecommerce 360 tool includes easy to use widgets for the most popular ecommerce Content Management Systems, including Shopify, Magento and Prestashop.

Let`s Get
In Touch
Contact us today for a free consultation
and cost estimate for
your project.
We work with companies in all
industries, big or small.
Give Us a Call: 786-529-6039
Services
©2024 FUZE DIGITAL INC. Ignite Your Brand™ | privacy


